CONTACT PERSON
Marketing :
General Manager :
Manufacturing Director :


Top cover_soft part
Mold Number:16033
Prepared by:Gavin Zhang
Date Prepared:July 5th 2019
Version:Rev.1
Analysis Purpose |
Validate potential problem after the part and mold design Check the fill balance pattern, weld line, air traps, and predict the needed clamp force and injection pressure, warpage. |
Input Model Description |
The runner system is simulated as the mold design. |
Result Required |
Filling result Warpage result |
Actual of cavities |
1+1 |
Number of cavity analysis |
1+1 |
Part Material |
TPE |
Type of analyses |
Flow + Warp |
■ The material datas are from supplier is in moldflow database and shown in the pictures below
Material Property |
|||
TPE (Thermolast K TP7VCZ from KRAIBURG ) |
Melt Temperature Range (℃) |
175~230 |
|
Solid Density (g/cm3) |
1.05 |
Mold Temperature Range (℃) |
5~60 |
Maximum Shear Rate (1/s) |
100006 |
Ejection Temperature (℃) |
102 |
Maximum Shear Stress (MPa) |
1 |
Absolute Maximum Melt Temperature (℃) |
250 |
MFR (g/10min) ( ℃/ Kg) |
/ |
Recommended Melt Temperature (℃) |
200 |
Filler |
Unfilled |
Recommended Mold Temperature (℃) |
30 |


| Part Details and Tool Description | |
Part Name |
Top cover_soft part |
CAD File / Version/ Date |
16033_nrgkick_dsgn_asm_190627 /stp |
Part Volume |
11 (1*1) cm^3 |
Nominal Wall Thickness |
2 mm |
Tool Description |
1*1 Cavity |
Injection machine Tonnage |
/ |
| Process Setup | |
Material |
TPE (Thermolast K TP7VCZ from KRAIBURG ) |
Injection time |
1.0 s |
Material temp |
200 [deg.c] |
Mold temp |
30 [deg.c] |
Velocity/Pressure Transfer (% volume) |
98 % |
Packing Pressure/Time |
80% filling pressure /8 s, 60% filling pressure /4 s |
Project Area |
41 (1*1 ) cm^2 |
Wall thickness
This above plot used different color to show the thickness of this part.
We can see that: the average thickness of this part is 2 mm.
Total part weight =11 g (1*1 ) , the cold runners weight = 6 g

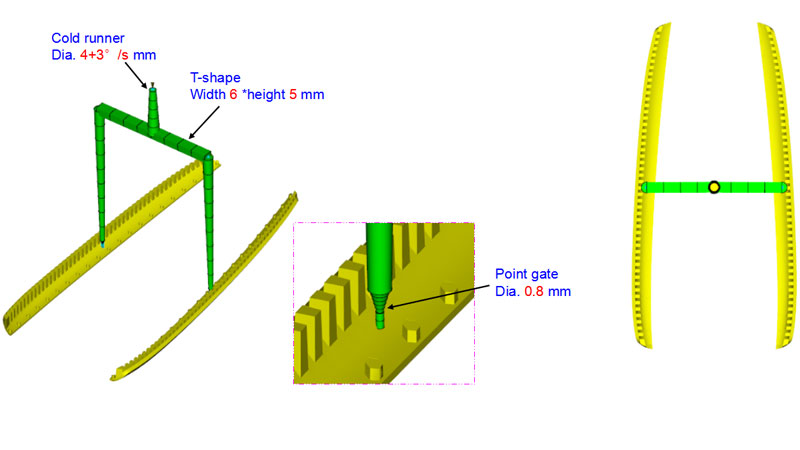
Gate Location and size
The mold is the cold runner and point gate.
The runner layout was based on the 3D drawing.

Simulation results list
Fill time (Animate & Contour)
Pressure at the V/P switchover
Injection pressure
Clamp Force
Weld lines
Air Traps
Time to freeze
Volumetric shrinkage at ejection
Deflection
Conclusions and suggestions
This result shows how the melt flows through the cavity. Fill time is about: 1.3 sec.
Shift+F5, you will see the animated flow

The area with dense lines in the above picture represents the area with lower flow velocity; and the area with sparse lines represents the area with higher flow velocity.

Pressure at V/P switchover
Above figure shows the pressure distribution through the flow path inside the mold, at the V/P switchover of the filling phase.

Clamp force
The maximum clamp force is 8.4 Tons.


No weld lines appear on the surface

Air trapped area
The result shows areas of the cavity that may require additional venting, it should be viewed in combination with the filling
pattern result. Air traps locations mark in red color.
Most of the air trapped appear at the edge of part and the tip of ribs that is easy to vent

Time to freeze
The time to reach ejection temperature is about 12 s for 95 % melt volume freezed, the cold runner is about 12 s for 60 % melt
volume freezed

Volumetric shrinkage at ejection
The maximum shrinkage at ejection is 6.3 %.The minimum shrinkage at ejection is 1 %.

Deflection-All
Note : warpage shape magnified 3X for display purposes. (The undeformed part display transparent). The maximum shrinkage and deflection value is about 0.14 mm.

X-deflection
Note : warpage shape magnified 3X for display purposes. (The undeformed part display transparent)
The black arrow indicates the shrinkage and deflection moved inward about 0.12 mm.
The red arrow indicates the shrinkage and deflection moved inward about 0.12 mm.

Y-deflection
The black arrow indicates the shrinkage and deflection moved inward about 0.08mm.
The red arrow indicates the shrinkage and deflection moved inward about 0.08 mm.

Z –deflection
The black arrow indicates the shrinkage and deflection moved downward about 0.09mm.
The red arrow indicates the shrinkage and deflection moved upward about 0.09 mm.

From the above analysis
■The cycle time is about:1.0 (filling) + 12.0 (cooling + packing ) + ? (open & eject) = ? sec
■ This part will not have filling problem due to the pressure are within the moldflow recommend range.
■ Visible weld lines were expected appear at this part. (refer page 14)
■ Most of the air trapped appear at the edge of part and the tip of ribs that is easy to vent, some serious air traps appear on the surface. (refer page 15)
■ Visible sink mark may appear at the surface of part. (refer page 16)
■ This part have large uneven shrinkage at the X, Y, Z deflection, the different volumetric shrinkage (different wall thickness) result in the defect.

EMM has a project management team with fluent English in technical communication, experienced
mold design team
Copyright © 2018 Euromicron Mould Engineering Limited | All Rights Reserved